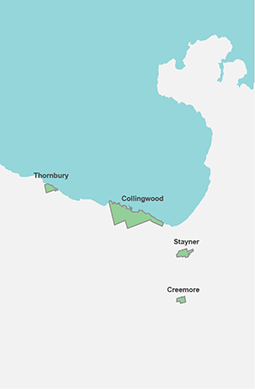
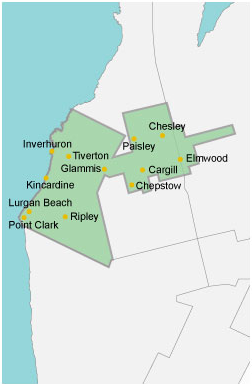
Welcome to EPCOR Our site is customized by location. Please select the region of your service and we’ll remember your selection for next time.
Select location

Our site is customized by location. Please select the region of your service and we’ll remember your selection for next time.

Change a country
Country Flag Canada
Country Flag United States

Select a region for customized content and rates
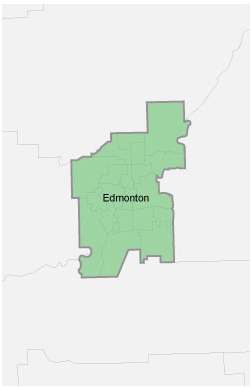
Mouse hover over any region to see the map here
Edmonton
All Alberta locations except Edmonton
French Creek
Aylmer and area
Collingwood and area
Kincardine and area
Select a state

Looks like you're in Canada

Looks like you're in the United States

Change country
Country Flag Canada
Country Flag United States

Select a region for customized content and rates
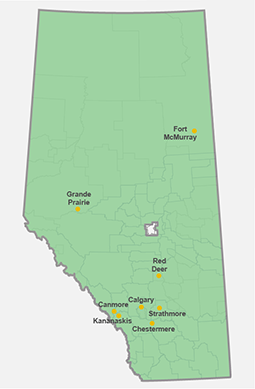
Mouse hover over any region to see the map here
Edmonton
All Alberta locations except Edmonton
French Creek
Aylmer and area
Collingwood and area
Kincardine and area

Select a region for customized content and rates
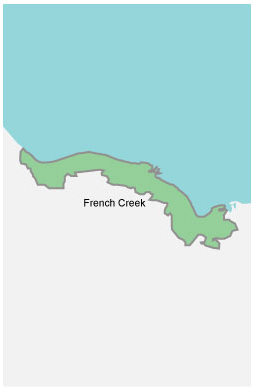
Select a region for customized content and rates
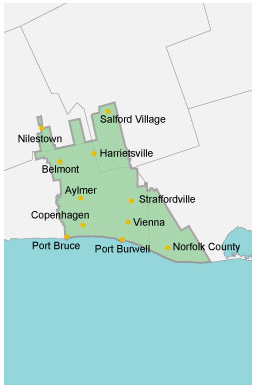
Choose your location
To view this page, set your location to:
Country Flag Country Flag
This page doesn’t match your location
To view this page, you must change your location to:
Country Flag Country Flag
Choose your location
To view this page, you must set your location to:
Country Flag Country Flag

Raw water turbidity

The following raw turbidity table is updated every 5 minutes. Only the most recent 3 hours of data are shown.

This data comes directly off EPCOR's computerized SCADA monitoring system and has not been validated. Please use it as a guideline only. There may be periods when these values will be unavailable.

The values represent raw water turbidity readings taken at two sample points of the North Saskatchewan River. These sample points are taken from the Rossdale and EL Smith Water Treatment Plants in Edmonton.

Each NTU reading (Rossdale and EL Smith) come from one of two meters - a high range meter and a low range meter. The meter is switched depending on the NTU reading set by any operator (ie. 50 NTU for ELS and 30 NTU for Rossdale). The turbidity of the selected meter is displayed on this page.

Date/Time Rossdale E.L. Smith
Dec. 15, 2024 08:55 AM 2 2.7
Dec. 15, 2024 08:50 AM 2 2.7
Dec. 15, 2024 08:45 AM 2 2.8
Dec. 15, 2024 08:40 AM 2.1 2.7
Dec. 15, 2024 08:35 AM 2.1 2.8
Dec. 15, 2024 08:30 AM 2.1 2.8
Dec. 15, 2024 08:25 AM 2.1 2.8
Dec. 15, 2024 08:20 AM 2.1 2.8
Dec. 15, 2024 08:15 AM 2.1 2.7
Dec. 15, 2024 08:10 AM 2 2.7
Dec. 15, 2024 08:05 AM 2.1 2.7
Dec. 15, 2024 08:00 AM 2 2.7
Dec. 15, 2024 07:55 AM 2.1 2.7
Dec. 15, 2024 07:50 AM 2.1 2.7
Dec. 15, 2024 07:45 AM 2.1 2.8
Dec. 15, 2024 07:40 AM 2 2.8
Dec. 15, 2024 07:35 AM 2 2.7
Dec. 15, 2024 07:30 AM 1.9 2.7
Dec. 15, 2024 07:25 AM 1.9 2.7
Dec. 15, 2024 07:20 AM 1.9 2.7
Dec. 15, 2024 07:15 AM 1.9 2.7
Dec. 15, 2024 07:10 AM 1.9 2.7
Dec. 15, 2024 07:05 AM 1.9 2.7
Dec. 15, 2024 07:00 AM 1.9 2.7
Dec. 15, 2024 06:55 AM 1.9 2.7
Dec. 15, 2024 06:50 AM 1.9 2.7
Dec. 15, 2024 06:45 AM 1.9 2.7
Dec. 15, 2024 06:40 AM 1.9 2.7
Dec. 15, 2024 06:35 AM 1.9 2.7
Dec. 15, 2024 06:30 AM 1.9 2.7
Dec. 15, 2024 06:25 AM 1.9 2.7
Dec. 15, 2024 06:20 AM 1.9 2.7
Dec. 15, 2024 06:15 AM 1.9 2.7
Dec. 15, 2024 06:10 AM 1.9 2.7
Dec. 15, 2024 06:05 AM 1.9 2.7
Dec. 15, 2024 06:00 AM 1.9 2.7
Dec. 15, 2024 05:55 AM 1.9 2.7
Dec. 15, 2024 05:50 AM 1.9 2.7
Dec. 15, 2024 05:45 AM 1.9 2.7
Dec. 15, 2024 05:40 AM 1.9 2.7
Dec. 15, 2024 05:35 AM 1.9 2.7
Dec. 15, 2024 05:30 AM 1.8 2.7
Dec. 15, 2024 05:25 AM 1.9 4.5
Dec. 15, 2024 05:20 AM 1.9 2.7
Dec. 15, 2024 05:15 AM 1.8 2.7
Dec. 15, 2024 05:10 AM 1.8 2.7
Dec. 15, 2024 05:05 AM 1.9 2.7
Dec. 15, 2024 05:00 AM 1.9 2.6

This site uses cookies to provide a better user experience and for advertising purposes. By using our website, you accept our use of cookies. Visit our Privacy Policy for more details.