Welcome to EPCOR Our site is customized by location. Please select the region of your service and we’ll remember your selection for next time.
Select location

Our site is customized by location. Please select the region of your service and we’ll remember your selection for next time.

Change a country
Country Flag Canada
Country Flag United States

Select a region for customized content and rates
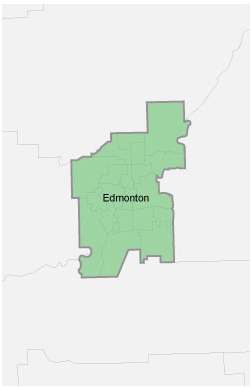
Mouse hover over any region to see the map here
Edmonton
All Alberta locations except Edmonton
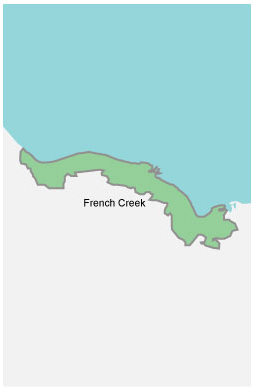
French Creek
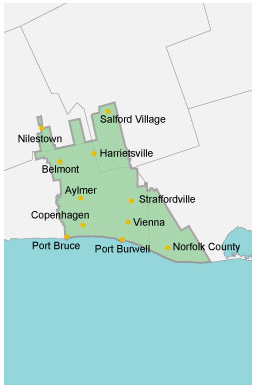
Aylmer and area
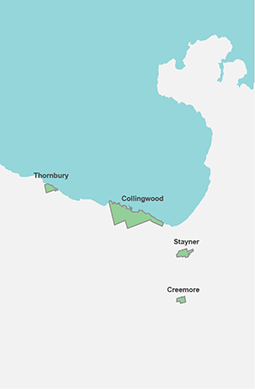
Collingwood and area
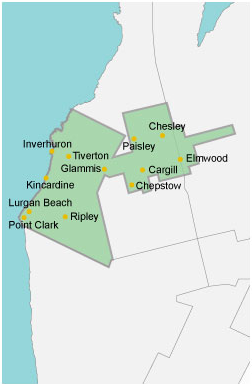
Kincardine and area
Select a state

Looks like you're in Canada

Looks like you're in the United States

Change country
Country Flag Canada
Country Flag United States

Select a region for customized content and rates
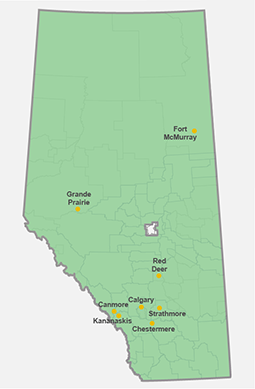
Mouse hover over any region to see the map here
Edmonton
All Alberta locations except Edmonton
French Creek
Aylmer and area
Collingwood and area
Kincardine and area

Select a region for customized content and rates
Select a region for customized content and rates
Choose your location
To view this page, set your location to:
Country Flag Country Flag
This page doesn’t match your location
To view this page, you must change your location to:
Country Flag Country Flag
Choose your location
To view this page, you must set your location to:
Country Flag Country Flag

Gold Bar air quality reports

Daily Measurements at the Gold Bar Park Air Quality Monitoring Station

This data comes directly off our computerized air quality monitoring system and has not been validated. Please use it as a guideline only. For verified monthly data, see the list of downloadable reports.

1. Alberta ambient air quality objectives

Alberta’s ambient air quality objectives (AAAQOs) and guidelines are developed under the Alberta Environmental Protection and Enhancement Act (EPEA). Objectives are developed to protect Alberta’s air quality. The 24-hour average AAAQO for H2S is 3 parts per billion (ppb).

2. Wind speed

Wind speed is caused by air moving from high to low pressure, usually due to changes in temperature or other local effects. Lower wind speeds generally mean less dispersion of air, potentially resulting in localized higher concentrations of elements. Higher wind speeds disperse air faster and over a wider area.

3. Wind direction

Wind direction is reported according to the direction from which it originates – for example, a north wind blows from north to south. Winds are usually reported using either cardinal directions, or degrees of direction.

4. Temperature

Air temperature affects the movement of air. Different temperatures between two locations create a difference in air pressure. The atmosphere tries to equalize the air pressure, forming wind.

5. Relative humidity

Humidity is the concentration of water vapor present in the air. Relative humidity is the ratio of a present state of humidity relative to a maximum humidity given the same temperature.

6. Barometric pressure

Barometric pressure is the air pressure, as measured within the atmosphere. It is quantified by the hydrostatic pressure caused by the weight of an air column above a measurement point. It is impacted by the planetary rotation and local effects such as, variations in temperature, density, air composition etc. Wind is generated by air movement from high to low pressure areas.

Ambient Air Quality Mo​nitoring Station ​​reports

The Gold Bar Park station, near the Gold Bar Wastewater Treatment Plant, continuously monitors ambient air quality. This data is published on our website on the 15th of each month. Please see the monthly reports below.

2024
AAQMS Report October 2024
1 MB
AAQMS Report September 2024
1 MB
AAQMS Report August 2024
691 KB
AAQMS Report July 2024
809 KB
AAQMS Report June 2024
1 MB
AAQMS Report May 2024
1 MB
AAQMS Report April 2024
1 MB
AAQMS Report March 2024
1 MB
AAQMS Report February 2024
1 MB
AAQMS Report January 2024
1 MB
2023
AAQMS Report December 2023
1 MB
AAQMS Report November 2023
1 MB
AAQMS Report October 2023
1 MB
AAQMS Report September 2023
1 MB
AAQMS Report August 2023
1 MB
AAQMS Report July 2023
1 MB
AAQMS Report June 2023
1 MB
AAQMS Report May 2023
1 MB
AAQMS Report April 2023
1 MB
AAQMS Report March 2023
1 MB
AAQMS Report February 2023
1 MB
AAQMS Report January 2023
1 MB
2022
AAQMS Report December 2022
1 MB
AAQMS Report November 2022
1 MB

Fenceline H2S Monitoring

As of November 1, 2023, daily fence line monitoring has been replaced by continuous monitoring at the Ambient Air Quality Monitoring Station. Please see archived reports below.

2023
Fenceline H2S Monitoring October 2023
603 KB
Fenceline H2S Monitoring September 2023
471 KB
Fenceline H2S Monitoring August 2023
146 KB
Fenceline H2S Monitoring July 2023
425 KB
Fenceline H2S Monitoring June 2023
138 KB
Fenceline H2S Monitoring May 2023
468 KB
Fenceline H2S Monitoring April 2023
131 KB
Fenceline H2S Monitoring March 2023
147 KB
Fenceline H2S Monitoring February 2023
428 KB
Fenceline H2S Monitoring January 2023
478 KB
2022
Fenceline H2S Monitoring December 2022
110 KB
Fenceline H2S Monitoring November 2022
93 KB
Fenceline H2S Monitoring October 2022
471 KB
Fenceline H2S Monitoring September 2022
469 KB
Fenceline H2S Monitoring August 2022
474 KB

This site uses cookies to provide a better user experience and for advertising purposes. By using our website, you accept our use of cookies. Visit our Privacy Policy for more details.