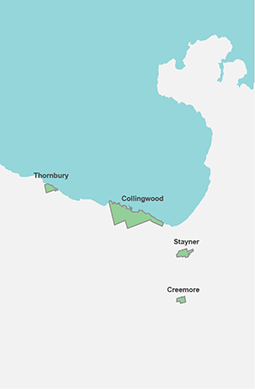
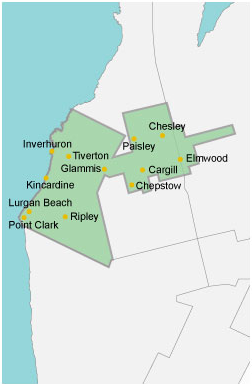
Our site is customized by location. Please select the region of your service and we’ll remember your selection for next time.
 Canada
                                        Canada
                                     United States
                                        United States
                                    Select a region for customized content and rates
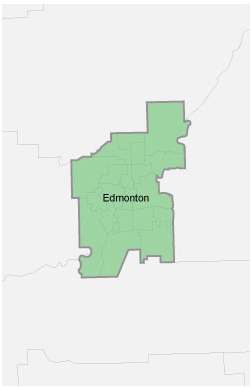


            Looks like you're in Canada
 
                            Looks like you're in the United States
 
                             Canada
                                        Canada
                                     United States
                                        United States
                                    Select a region for customized content and rates
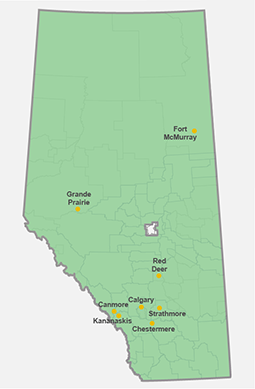


                                    Select a region for customized content and rates
Select a region for customized content and rates


                                This data comes directly off EPCOR's computerized SCADA monitoring system and has not been validated. Please use it as a guideline only. There may be periods when these values will be unavailable.
The values represent raw water turbidity readings taken at two sample points of the North Saskatchewan River. These sample points are taken from the Rossdale and EL Smith Water Treatment Plants in Edmonton.
Each NTU reading (Rossdale and EL Smith) come from one of two meters - a high range meter and a low range meter. The meter is switched depending on the NTU reading set by any operator (ie. 50 NTU for ELS and 30 NTU for Rossdale). The turbidity of the selected meter is displayed on this page.
| Date/Time | Rossdale | E.L. Smith | 
|---|---|---|
| Oct. 30, 2025 19:00 PM | 6.5 | 3.4 | 
| Oct. 30, 2025 18:55 PM | 6.5 | 3.4 | 
| Oct. 30, 2025 18:50 PM | 6.6 | 3.4 | 
| Oct. 30, 2025 18:45 PM | 6.6 | 3.5 | 
| Oct. 30, 2025 18:40 PM | 6.6 | 3.5 | 
| Oct. 30, 2025 18:35 PM | 6.7 | 3.5 | 
| Oct. 30, 2025 18:30 PM | 6.7 | 3.5 | 
| Oct. 30, 2025 18:25 PM | 6.9 | 3.5 | 
| Oct. 30, 2025 18:20 PM | 7 | 3.5 | 
| Oct. 30, 2025 18:15 PM | 6.9 | 3.4 | 
| Oct. 30, 2025 18:10 PM | 6.7 | 3.5 | 
| Oct. 30, 2025 18:05 PM | 6.7 | 3.5 | 
| Oct. 30, 2025 18:00 PM | 6.8 | 3.6 | 
| Oct. 30, 2025 17:55 PM | 6.8 | 3.6 | 
| Oct. 30, 2025 17:50 PM | 6.8 | 3.6 | 
| Oct. 30, 2025 17:45 PM | 6.7 | 3.6 | 
| Oct. 30, 2025 17:40 PM | 6.8 | 3.6 | 
| Oct. 30, 2025 17:35 PM | 6.8 | 3.6 | 
| Oct. 30, 2025 17:30 PM | 6.8 | 3.6 | 
| Oct. 30, 2025 17:25 PM | 6.9 | 3.6 | 
| Oct. 30, 2025 17:20 PM | 6.9 | 3.7 | 
| Oct. 30, 2025 17:15 PM | 6.9 | 3.7 | 
| Oct. 30, 2025 17:10 PM | 6.9 | 3.7 | 
| Oct. 30, 2025 17:05 PM | 7 | 3.7 | 
| Oct. 30, 2025 17:00 PM | 6.9 | 3.7 | 
| Oct. 30, 2025 16:55 PM | 7 | 3.8 | 
| Oct. 30, 2025 16:50 PM | 7 | 3.8 | 
| Oct. 30, 2025 16:45 PM | 6.9 | 4 | 
| Oct. 30, 2025 16:40 PM | 6.9 | 3.8 | 
| Oct. 30, 2025 16:35 PM | 6.9 | 3.8 | 
| Oct. 30, 2025 16:30 PM | 7 | 3.8 | 
| Oct. 30, 2025 16:25 PM | 6.9 | 3.8 | 
| Oct. 30, 2025 16:20 PM | 7 | 3.8 | 
| Oct. 30, 2025 16:15 PM | 7.1 | 3.9 | 
| Oct. 30, 2025 16:10 PM | 7 | 3.9 | 
| Oct. 30, 2025 16:05 PM | 7 | 3.9 | 
| Oct. 30, 2025 16:00 PM | 7.1 | 4 |