Select location
Our site is customized by location. Please select the region of your service and we’ll remember your selection for next time.
Change a country
 Canada
 United States
Select a region for customized content and rates
British Columbia
Select a region
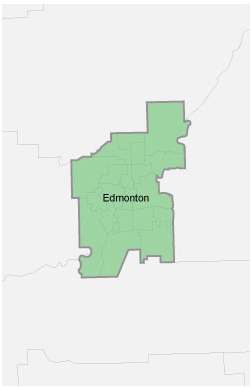
Edmonton
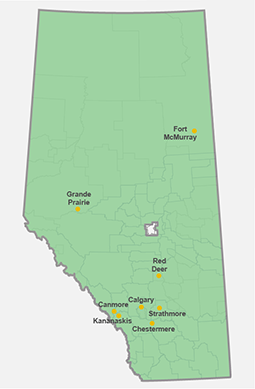
All Alberta locations except Edmonton
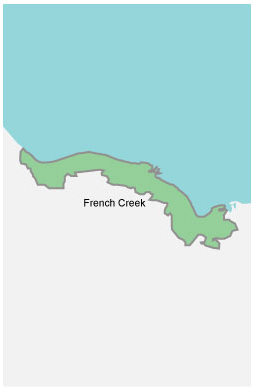
French Creek
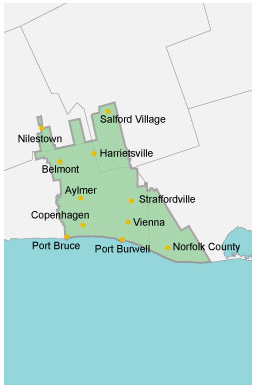
Aylmer and area
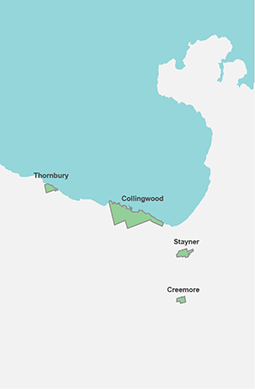
Collingwood and area
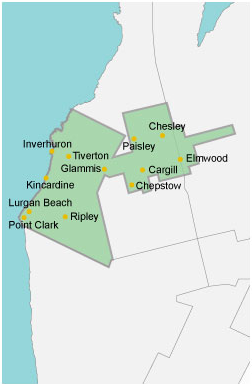
Kincardine and area
Select a state
Looks like you're in Canada
Looks like you're in the United States
Select a region for customized content and rates
British Columbia
Edmonton
All Alberta locations except Edmonton
French Creek
Aylmer and area
Collingwood and area
Kincardine and area
Select a region for customized content and rates
British Columbia
Select a region for customized content and rates
Choose your location
This page doesn’t match your location
Choose your location